
Editorial note: This article was originally published on My Inner Creative and has been updated and republished in May 2026 under The Vessel’s editorial standards.
A period tracker is a page in a bullet journal that records the days of a menstrual cycle alongside whatever else the journaler finds useful to mark: physical symptoms, energy, mood, sleep, the use of contraception, the timing of any related medical appointments. The page does not change the cycle. What it changes is the level of attention paid to it. A cycle held in memory is the cycle as remembered; a cycle held on a page is the cycle as it actually moved through the months, with the days written down and the patterns becoming visible across a longer view.
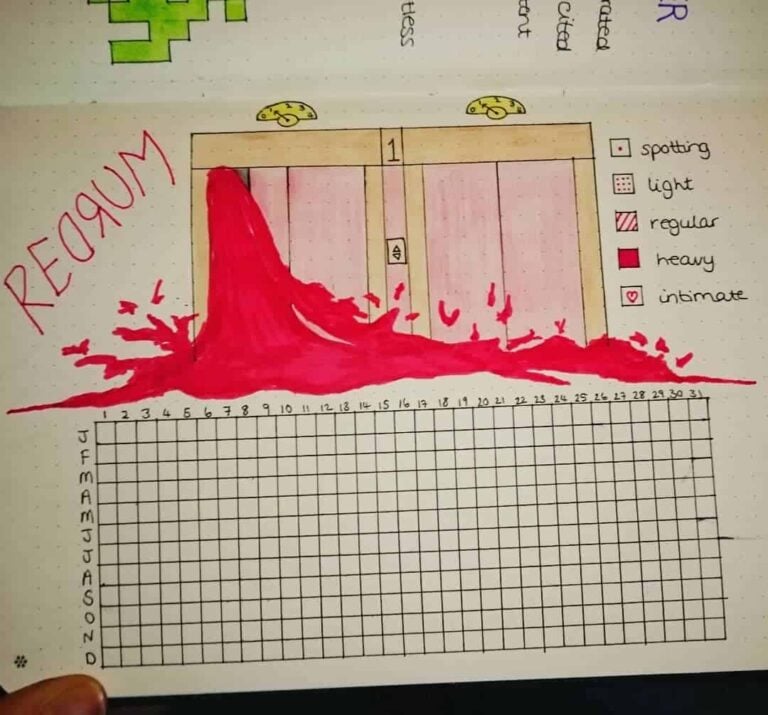
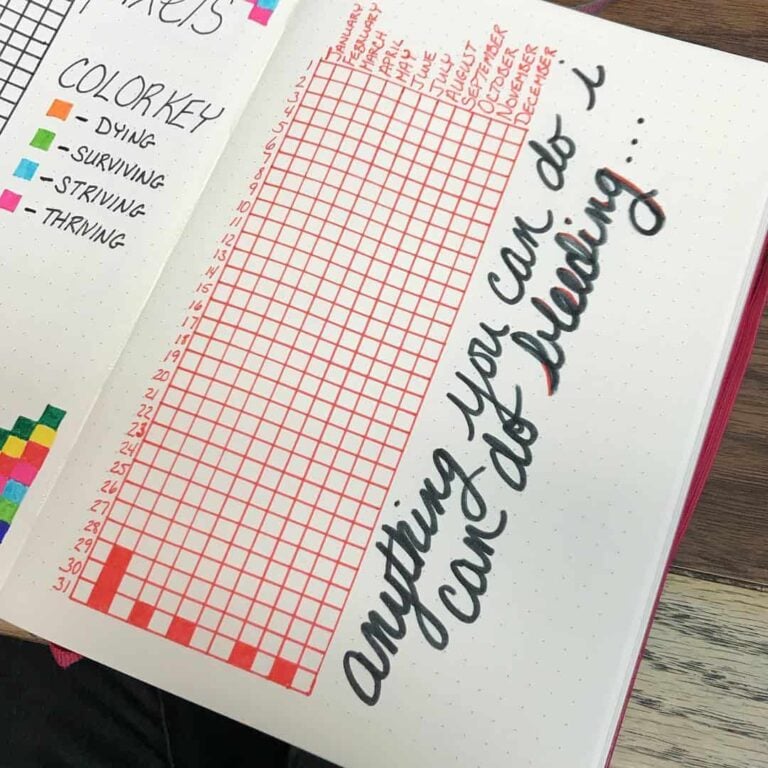
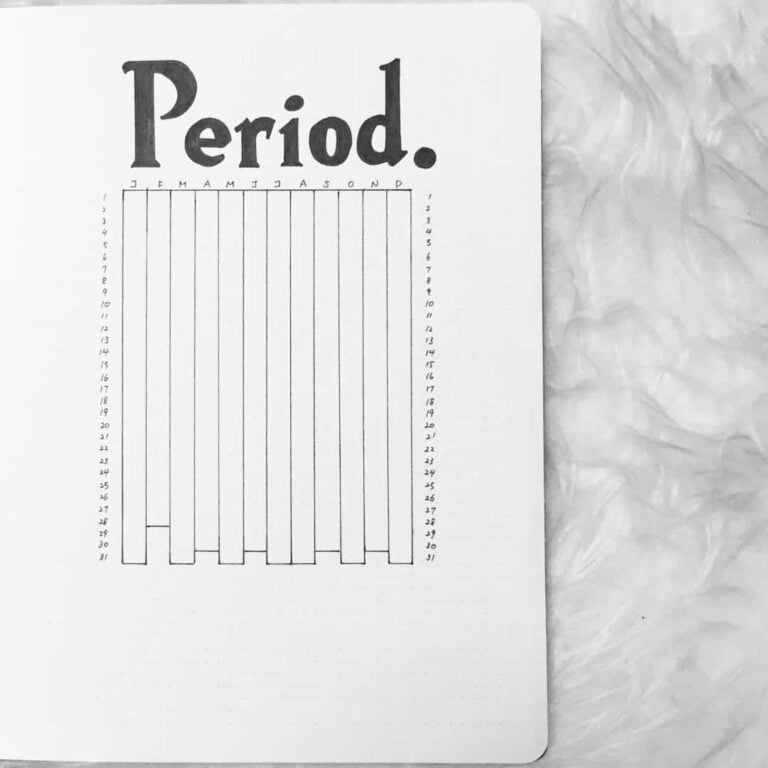
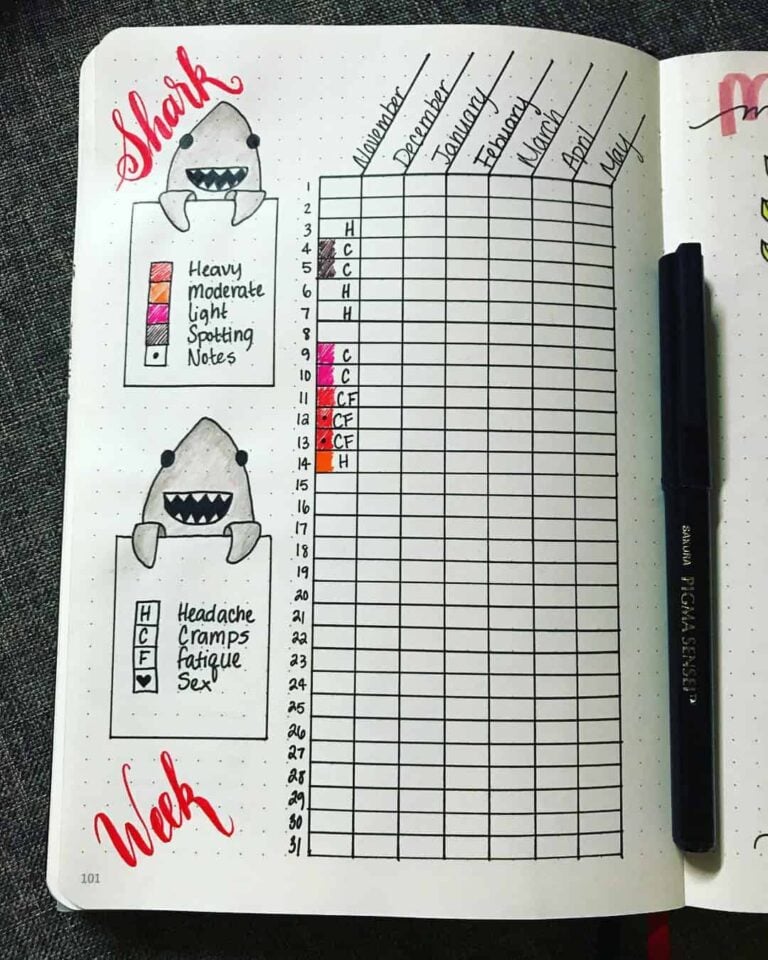
The spreads collected below were originally featured on My Inner Creative as a survey of how people who menstruate have built cycle-tracking pages into their bullet journals. They include simple bleeding-day calendars, layered trackers that combine flow with symptoms and mood, full-cycle dashboards used for fertility awareness, and a number of more decorative pages that fold the tracker into a wider monthly spread.
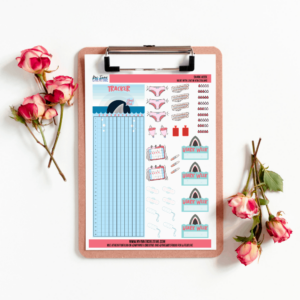
What a period tracker typically holds
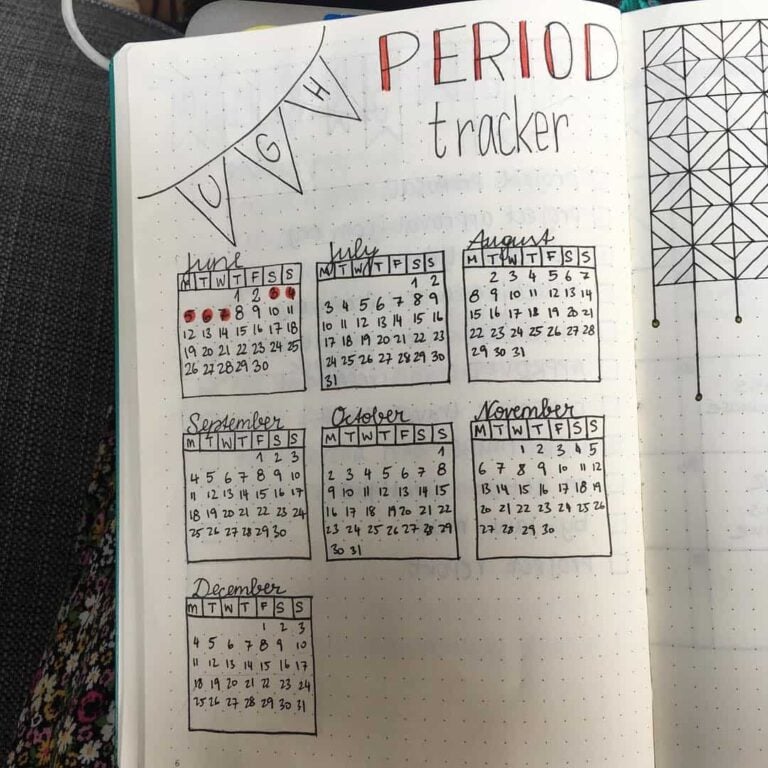
The most basic version of the page is a small calendar with the bleeding days marked. A circle, a coloured square, a small drop of ink — whichever visual marker the journaler prefers — placed on each day of the period. Across a few months, the calendar shows the cycle length and any drift from one month to the next. A page that records only that, and nothing else, is enough to make patterns visible that are otherwise easy to forget.
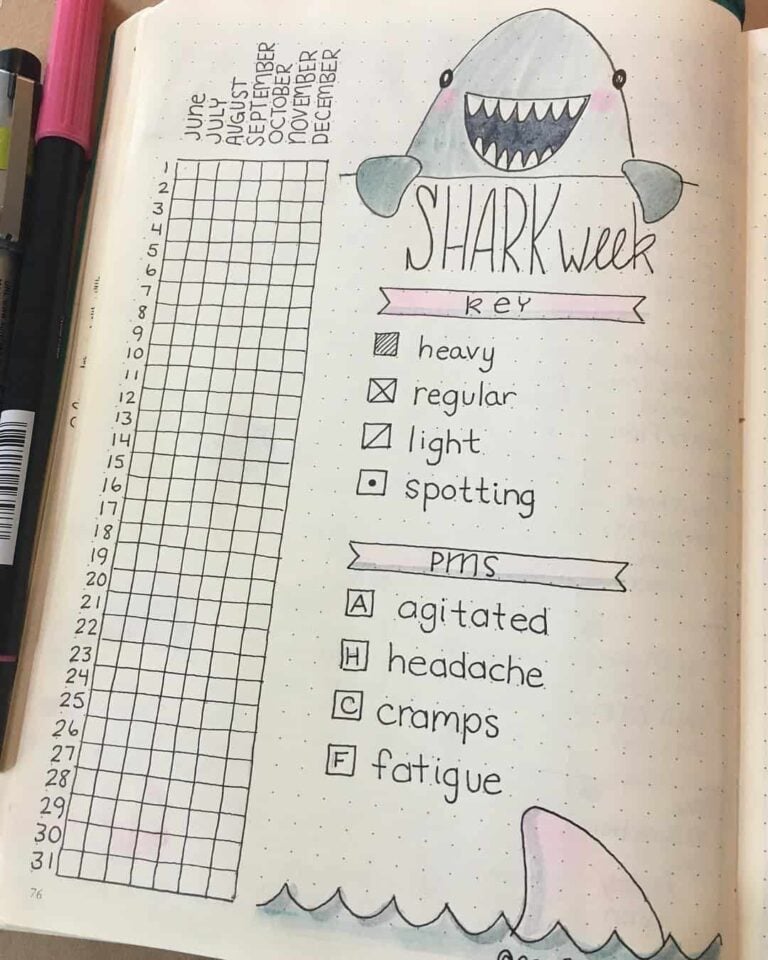
Most spreads in the gallery below carry additional information alongside the bleeding-day marker. Common companions are flow intensity (light, moderate, heavy), the presence or absence of cramps, headaches, breast tenderness, energy level, mood, sleep quality, and the use of any related medication or supplement. None of these are required; a tracker is more useful when it records only what the journaler will actually fill in. A page that asks for ten data points and gets two is less useful than a page that asks for three and gets all three.
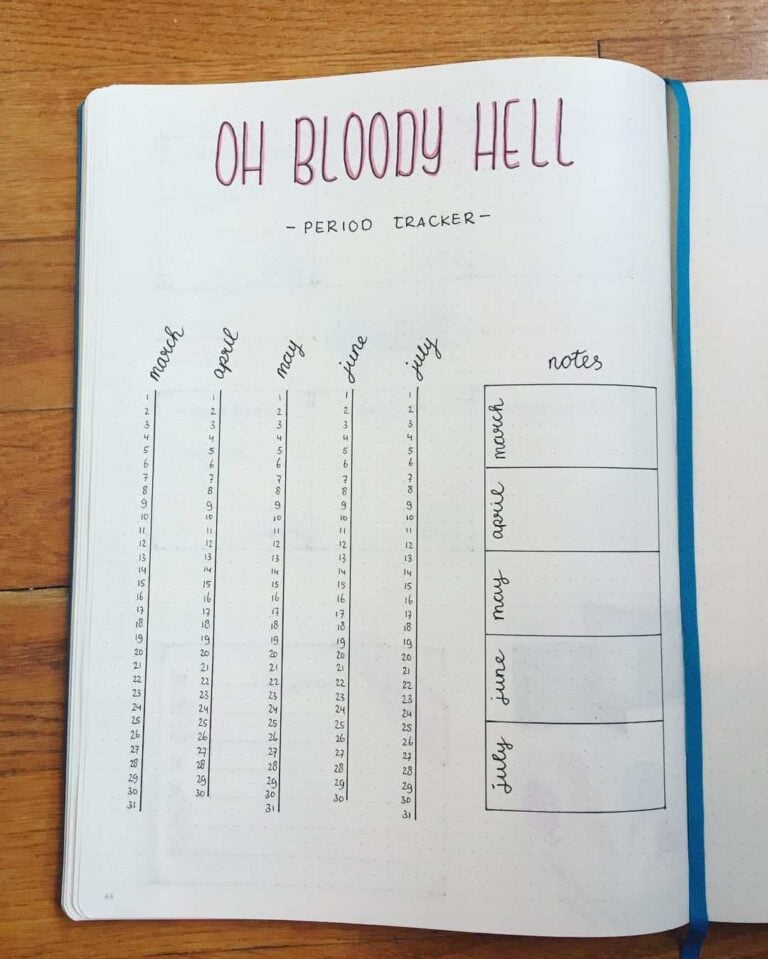
Why some trackers get abandoned
The gap between setting up a tracker and keeping one is wider than it first appears. A page designed on a Sunday afternoon, when there is time to draw a full monthly calendar with labelled columns and a colour key, has to be filled in on a Tuesday evening when that same time is not available. The spreads that survive past the third month are almost always the ones that were designed for the worst version of the week, not the best. A tracker that takes forty-five seconds to fill in tends to outlast one that takes five minutes, even if the five-minute version holds more information.
The other common reason for abandonment is that the tracker asks for data the journaler does not actually find interesting. A column for basal body temperature is only worth drawing if the journaler is prepared to take the reading every morning before getting up. However, note that those using cycle data for fertility planning or contraception decisions should do so with guidance from a healthcare provider, not from a journal page alone.
A mood grid covering five emotional states is only worth the space if mood is something the journaler cares to record. The decision about what to include is really a decision about what the journaler is genuinely curious about — and that is not always what seems most comprehensive at the outset.
A stripped-back tracker that the journaler fills in without thinking about it will, over the course of a year, produce a more complete and useful record than an elaborate one that gets filled in for six weeks and then left. The best design is the one that gets used.
How the page is usually laid out
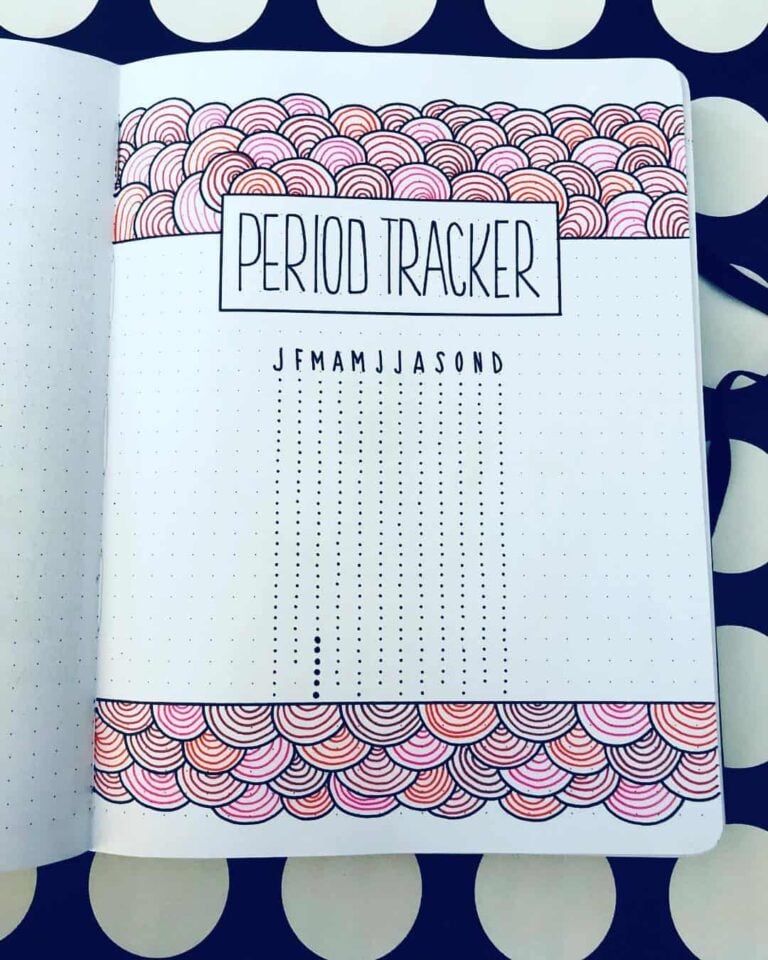
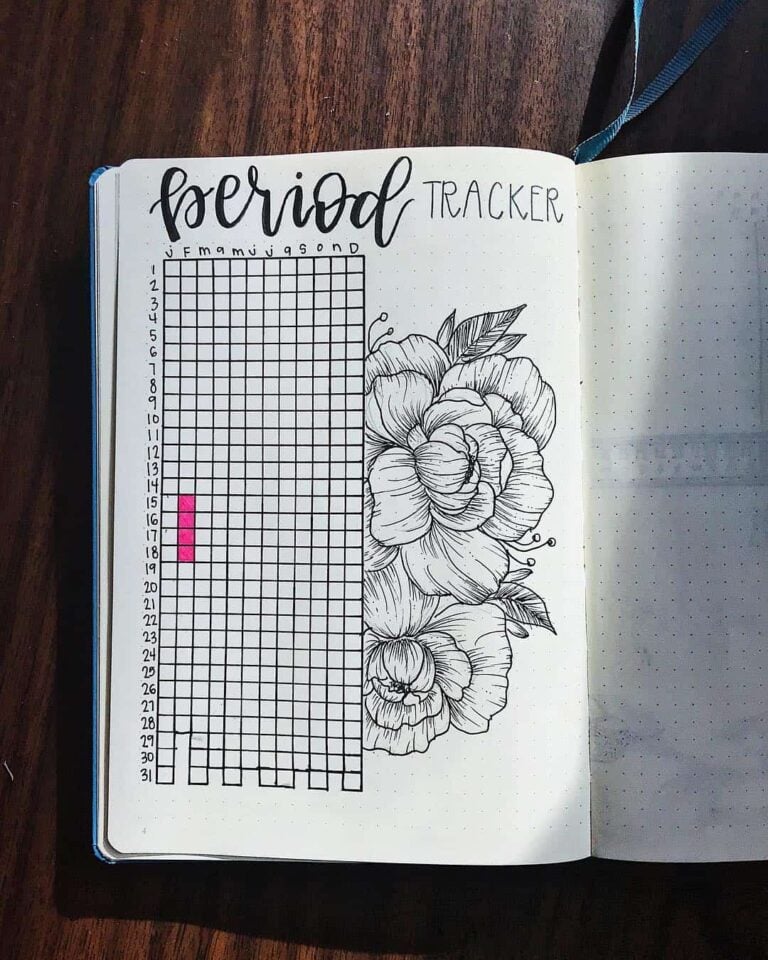
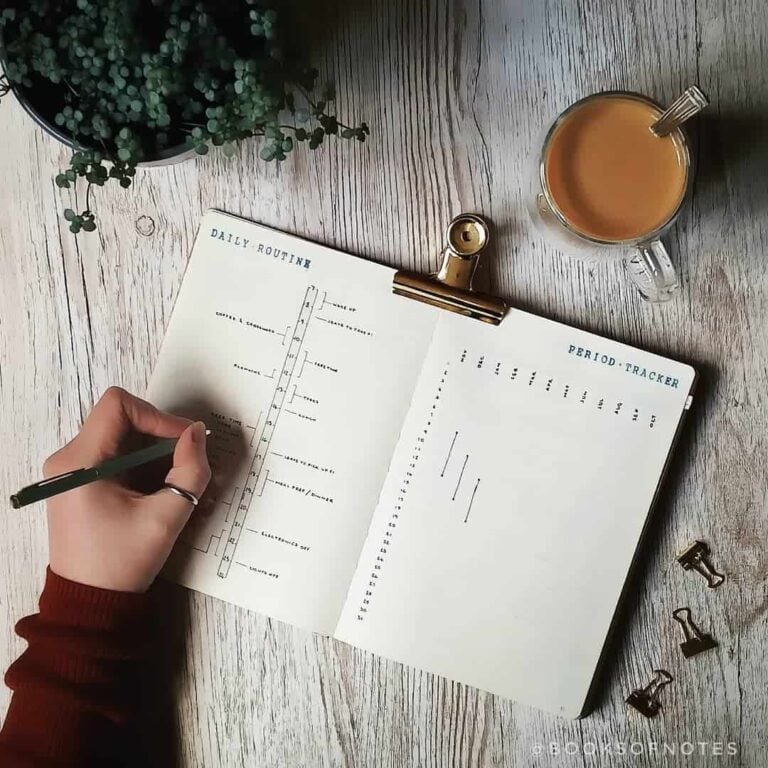
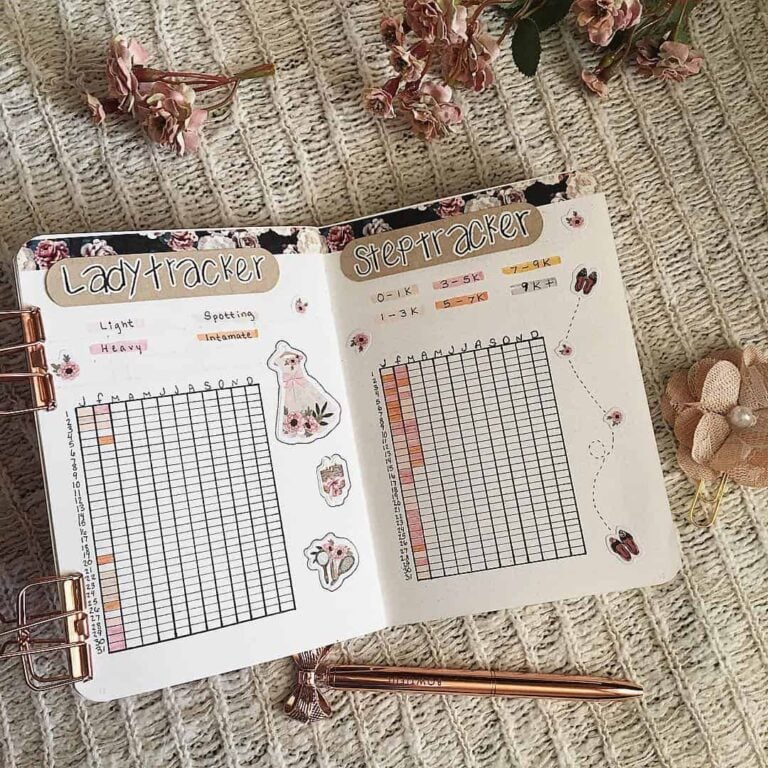
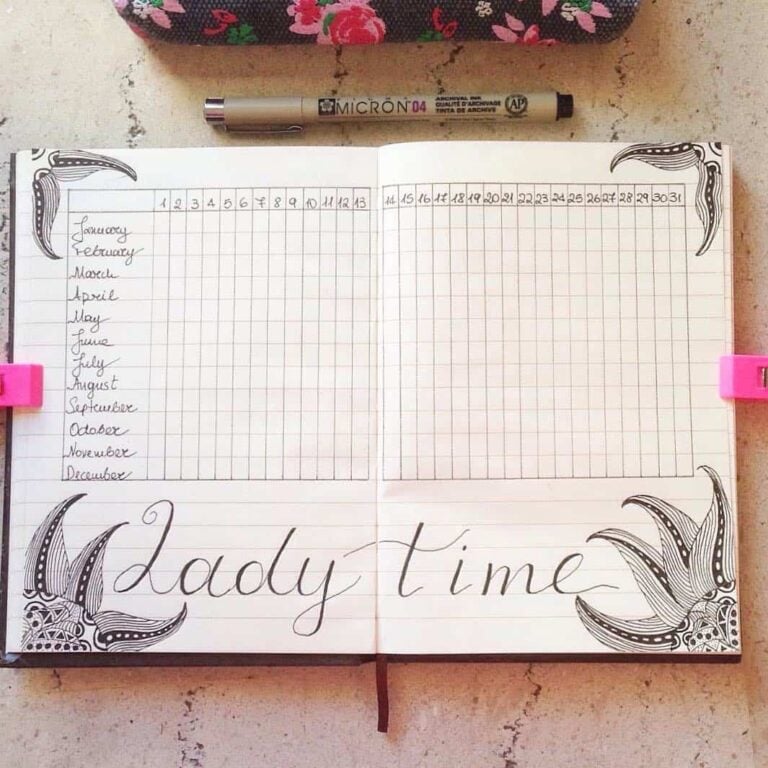
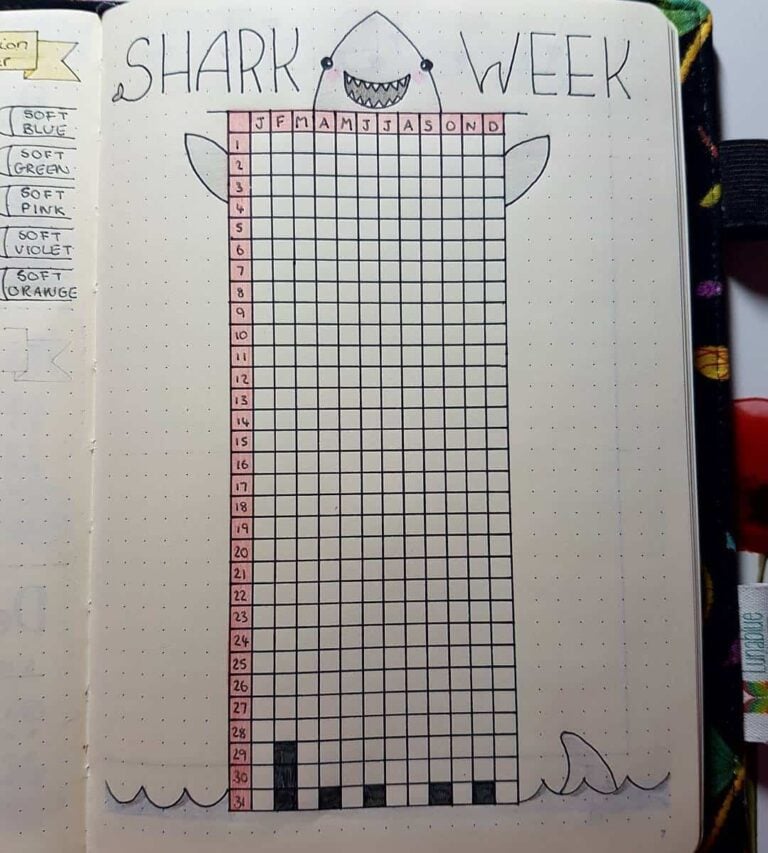
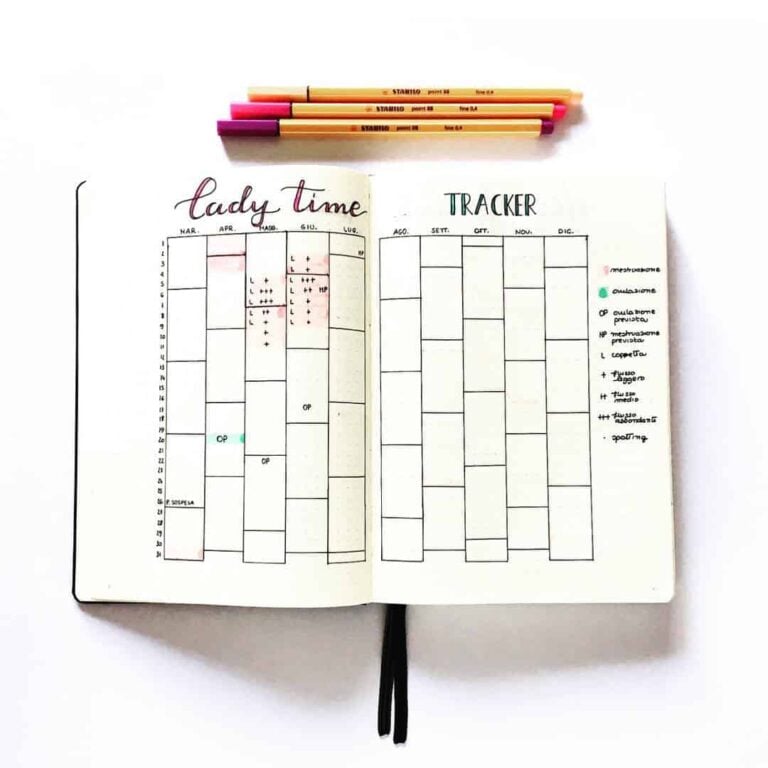
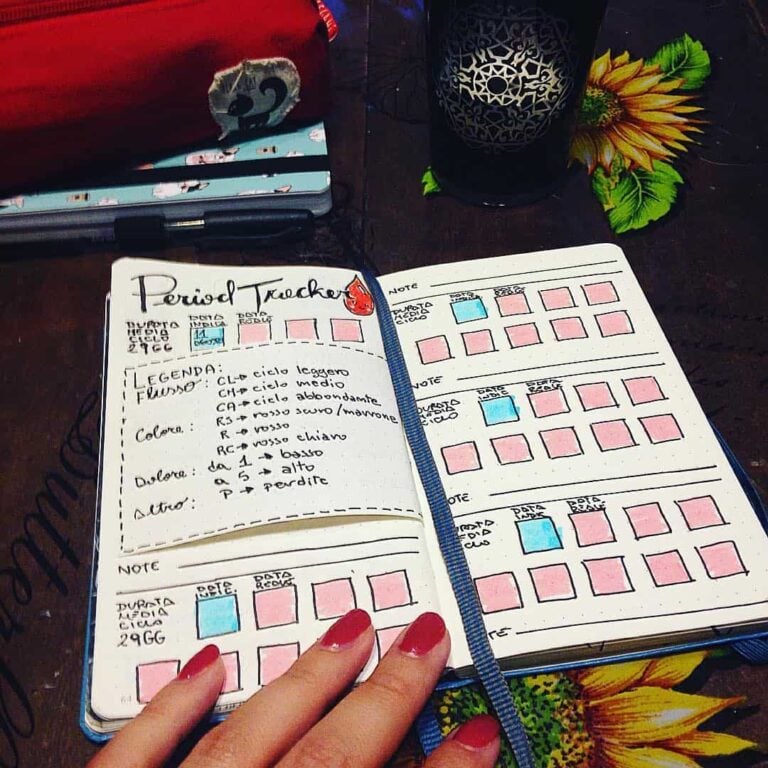
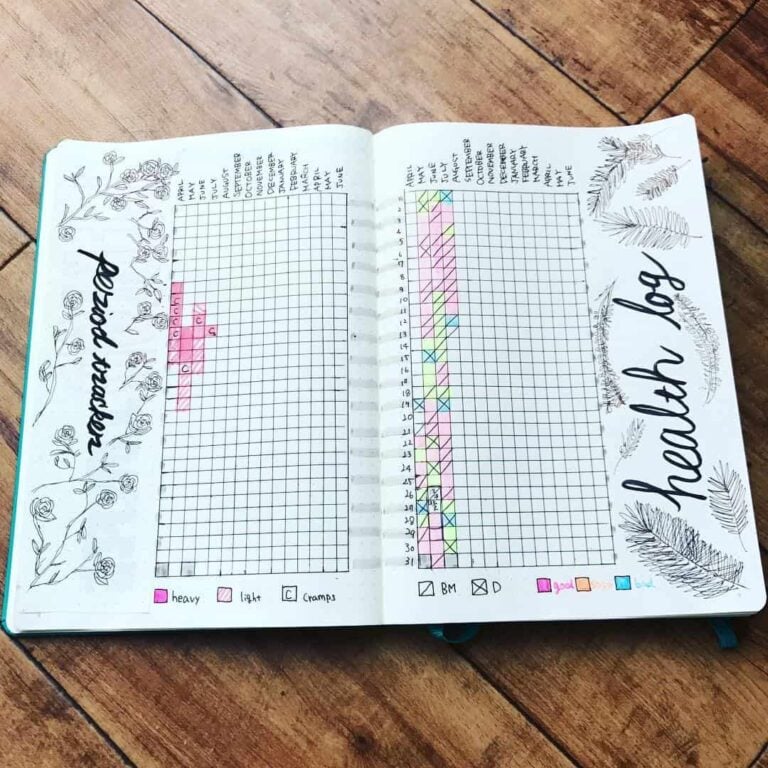
Three formats appear repeatedly. The first is a horizontal calendar — a row for each month of the year, a column for each day of the month, and the cycle marked across the row. The format makes year-on-year comparison easy and uses very little space. The second is a circular layout, often drawn as a clock face with one segment per day of the cycle, used for tracking a single cycle in detail rather than many cycles at a glance. The third is a vertical list, where each cycle gets its own row with the start date, the end date, the length, and a small set of notes.
The visual style of the page varies more than the format. Some spreads in the gallery use a single dot per bleeding day on an otherwise plain monthly calendar. Others use a colour-coded system that breaks the cycle into its phases — menstrual, follicular, ovulatory, luteal — with each phase shaded in a different tone. The colour-coded version is more time-consuming to draw and to maintain, and the spreads that use it tend to be the ones from journalers who are using the tracker for fertility awareness or for cycle-aware planning rather than only for record-keeping.
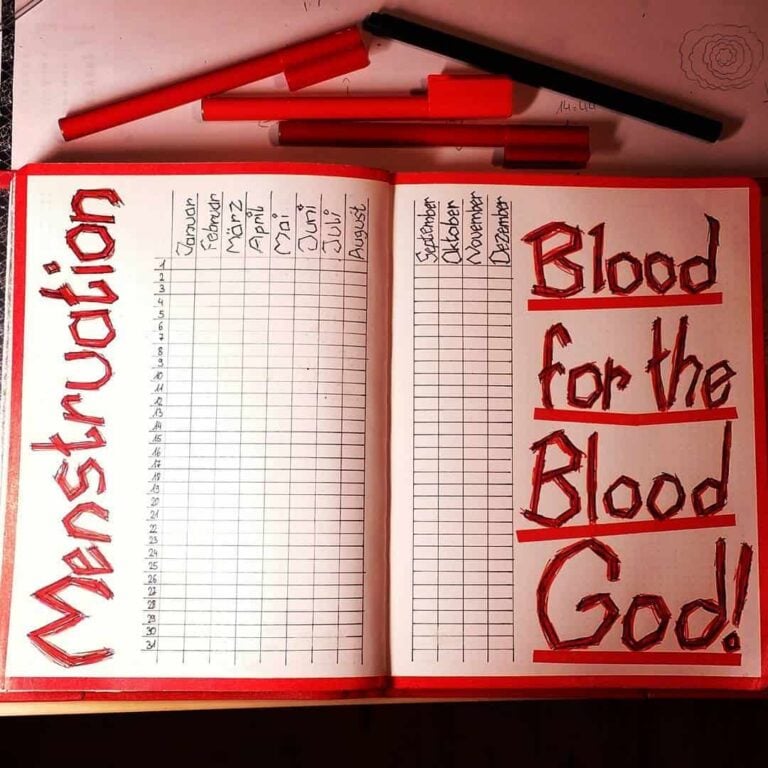
What people often track alongside the bleeding days
Across the gallery, the following entries recur:
- Cycle length, measured from the first day of one period to the first day of the next.
- Flow intensity, noted as a short label or a small icon.
- Physical symptoms — cramps, headaches, bloating, breast tenderness — with a tick or a brief note.
- Mood and energy level, often recorded on the same daily log as other habit-tracker entries.
- Sleep quality and total hours slept, which several spreads correlate with cycle phase.
- The use of contraception or other relevant medication, with a small mark on the relevant days.
- The use of pads, tampons, or a menstrual cup, sometimes with a count.
- For those tracking fertility, basal body temperature, ovulation indicators, and any test results.
The longer the list of categories, the more discipline the page asks of the journaler. Several of the spreads below started as elaborate full-cycle dashboards and were later simplified to two or three columns. The simpler page survived the rest of the year; the elaborate one did not.
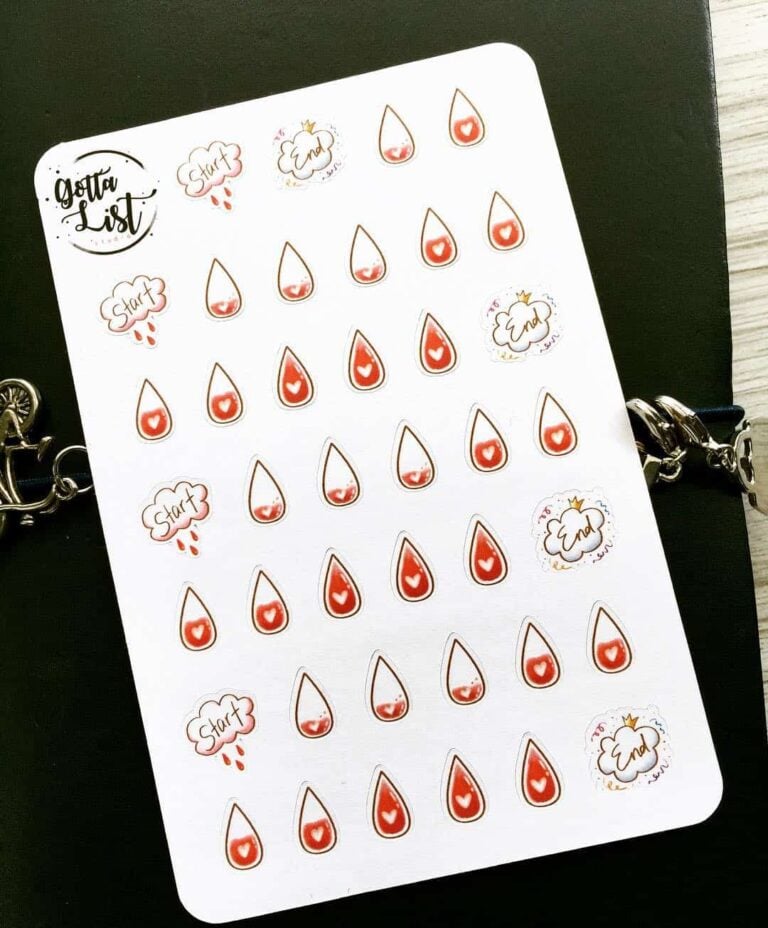
Privacy and shared notebooks
A bullet journal often lives in a shared space — a desk, a kitchen counter, a bag that gets left open. For a tracker that the journaler would rather not have read in passing, a few small workarounds appear in the gallery. The first is a dedicated section at the back of the notebook, marked with a single tab and kept separate from the daily and weekly spreads. The second is a code: a colour, an unrelated icon, or a name that means nothing to anyone else — a single small dot in a particular shade — used to mark the relevant days without any written label.
The third is a separate small notebook for the tracker alone, kept somewhere private. The choice is not really about secrecy; it is about whether the page can be filled in honestly without being filtered for who might read it. A tracker that the journaler is editing for an audience is a tracker that is recording the wrong information.
How long a tracker takes to become useful
A single month of entries is almost never enough. One cycle tells a journaler where the period started and how long it lasted. What it cannot tell is whether that is typical. The record becomes genuinely informative somewhere between three and six months in, once there is enough data to distinguish a consistent pattern from a one-off. Cycle length that falls in roughly the same range each month, symptoms that appear at the same phase consistently, an energy dip that shows up reliably in the same week — these are patterns. A single data point is not a pattern; it is a data point.
This is worth knowing before starting a tracker, because the first couple of months can feel like a lot of effort for very little return. The page is filling up with marks, but nothing is obvious yet. That is normal. The observations that turn out to matter are usually the ones that were not obvious on the day they were recorded — only in retrospect, when the same entry has appeared five times in a row, does the significance become clear.
The practical implication is that the start of a new tracker is not a good time to over-design the page. A simple format that can be maintained for six months without effort will produce more usable information than a detailed format that gets redesigned halfway through because it is too much to keep up with.
When the tracker becomes useful
The page itself does almost nothing on any single day. Marking a bleeding day takes a second, and the marker on its own is not informative. What the page does over the course of several months is make patterns visible. Cycle length stabilising or shifting, symptoms clustering at particular phases, energy or mood reliably dropping at the same point in the month — these are observations that the page surfaces and that memory alone tends not to. Some of those observations are the kind that are worth raising with a clinician at a routine appointment; others are simply useful for planning the weeks the journaler controls.
The tracker does not diagnose, predict, or replace medical advice. It is a record. The record’s value is the record itself: months of small entries that, taken together, describe the cycle as it actually moves rather than the cycle as remembered. That description is the part of the practice that most often turns out to have been worth keeping.
Choosing a format that fits the notebook
The format a tracker takes depends partly on how much space the journaler is willing to give it. A full-page monthly spread with columns for symptoms, mood, flow, and sleep will produce a richer record than a small calendar in the corner of a weekly layout — but it will also require a full page every month, and the journaler who resents giving it that space will stop filling it in. The right amount of space is the amount the journaler will actually use.
Notebook size is a practical constraint that gets overlooked when trackers are designed from scratch. A spread that works beautifully in an A5 notebook may be too cramped in a pocket-sized one, and a layout designed for a large A4 page will look sparse in a standard Leuchtturm or Moleskine. The spreads in the gallery below span a range of sizes and levels of detail. They are included not as templates to copy precisely but as a reference for what different formats look like in practice — the proportions, the amount of information that fits comfortably in a single spread, and the visual choices that distinguish a tracker used for habit recording from one used for fertility awareness.
Featured period tracker spreads
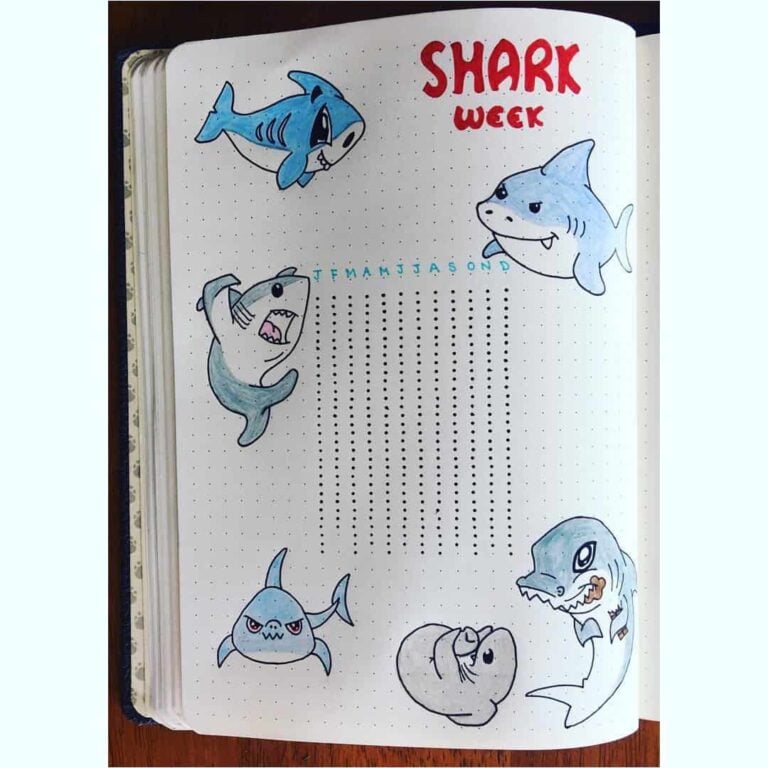
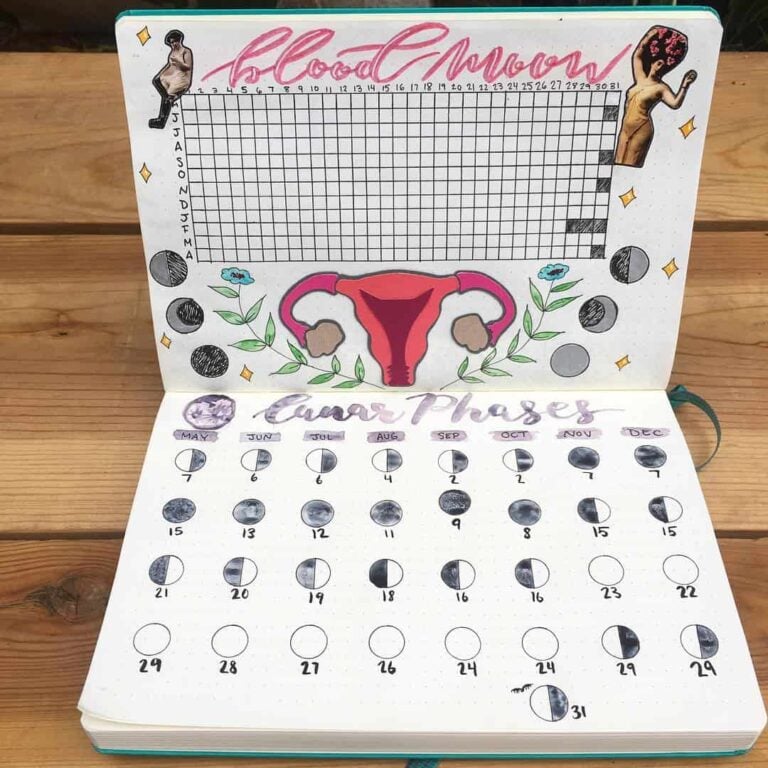
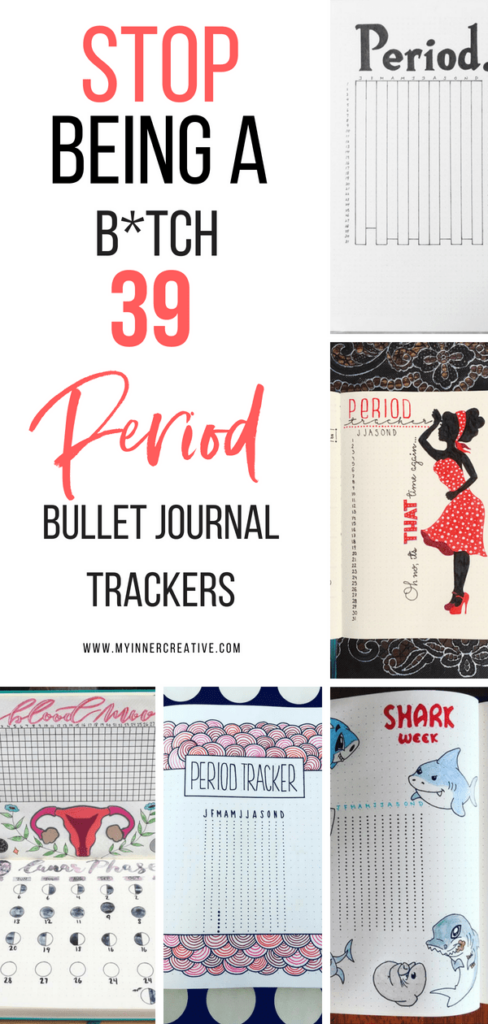
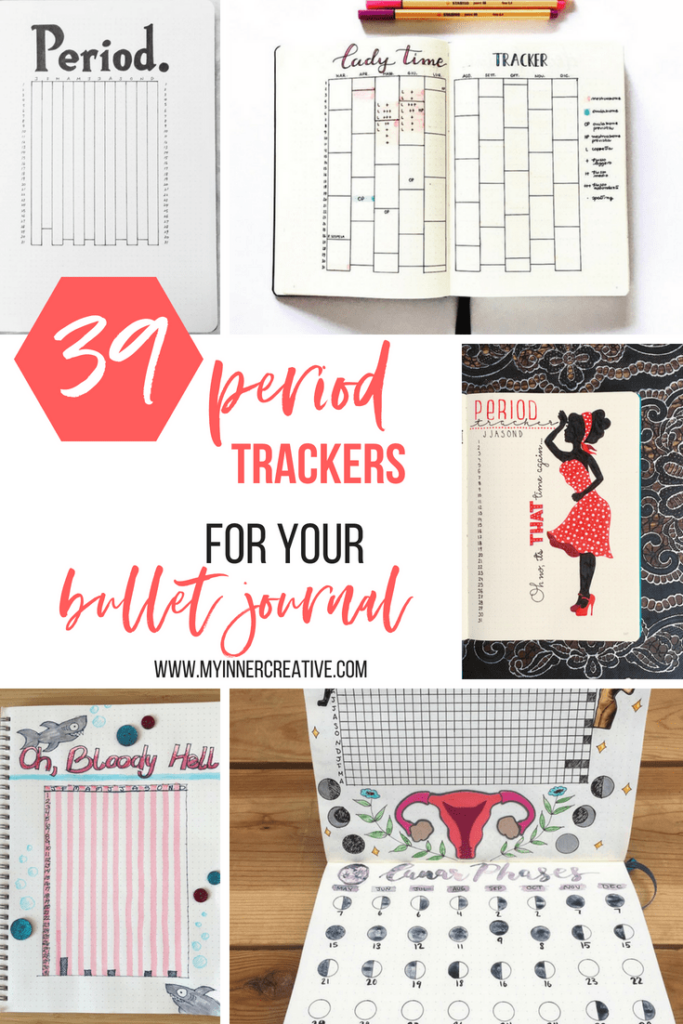
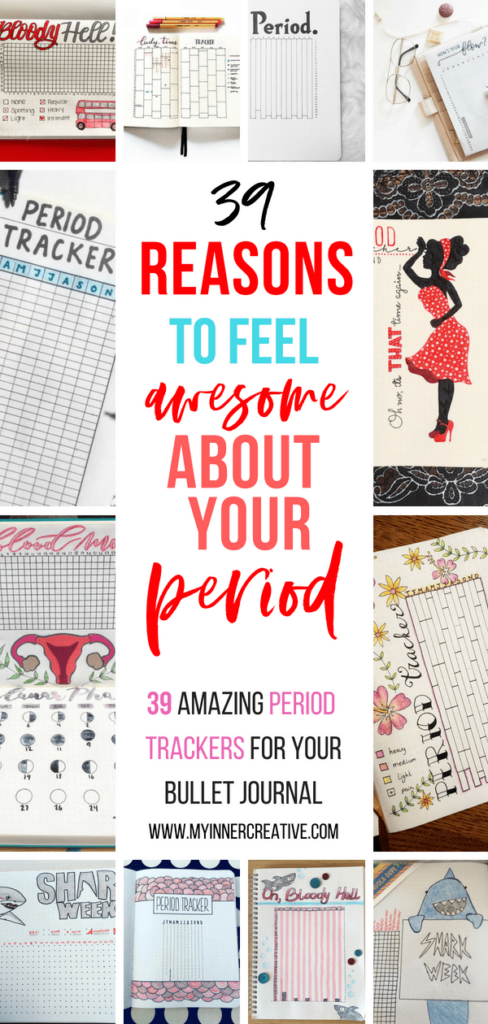
The spreads collected below come from the My Inner Creative community and span the simplest one-dot-per-day calendars, full-cycle dashboards, fertility-aware layouts with multiple data columns, and several decorative variants that fold the tracker into a wider monthly spread. They are included as a visual reference; any one of them can be redrawn in a notebook with a pen and a small set of coloured markers.
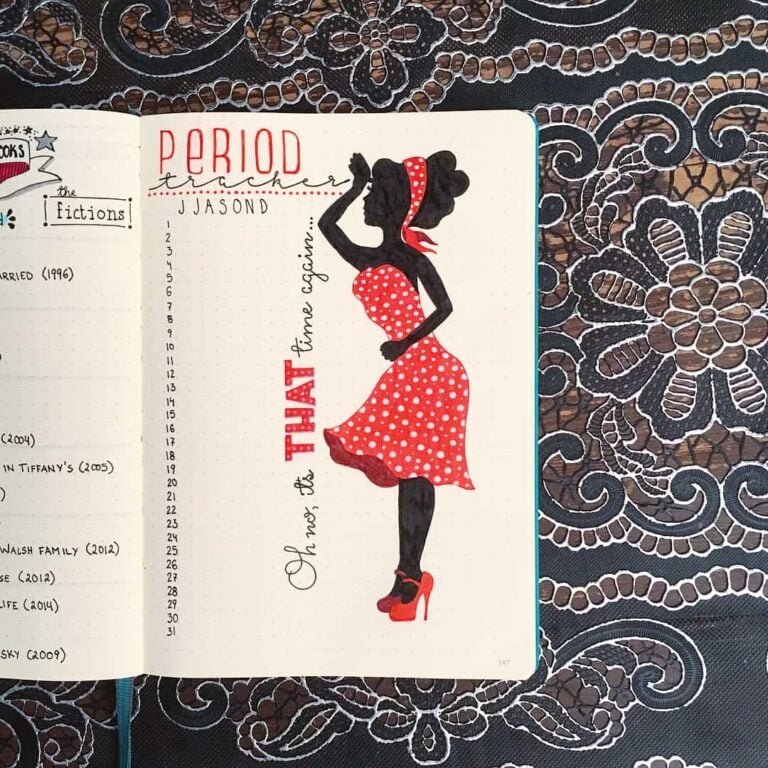
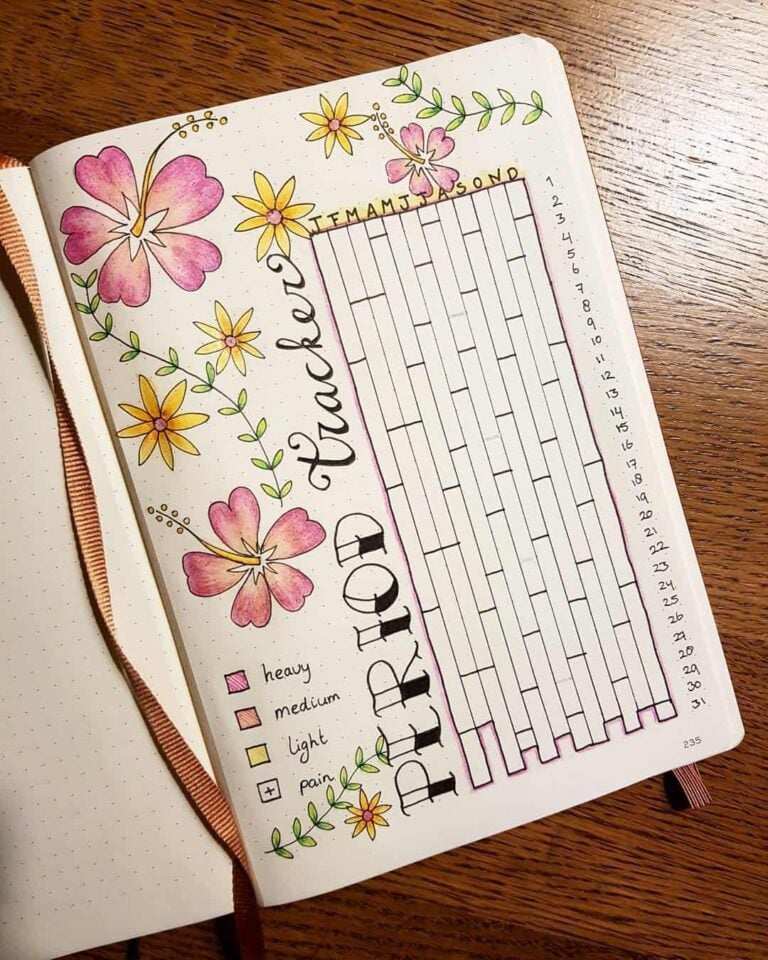
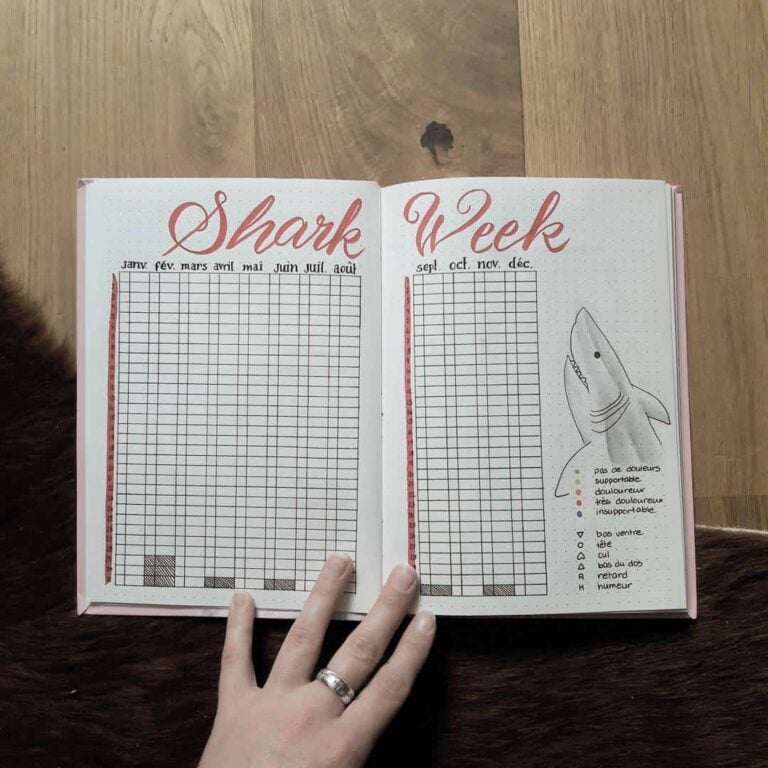

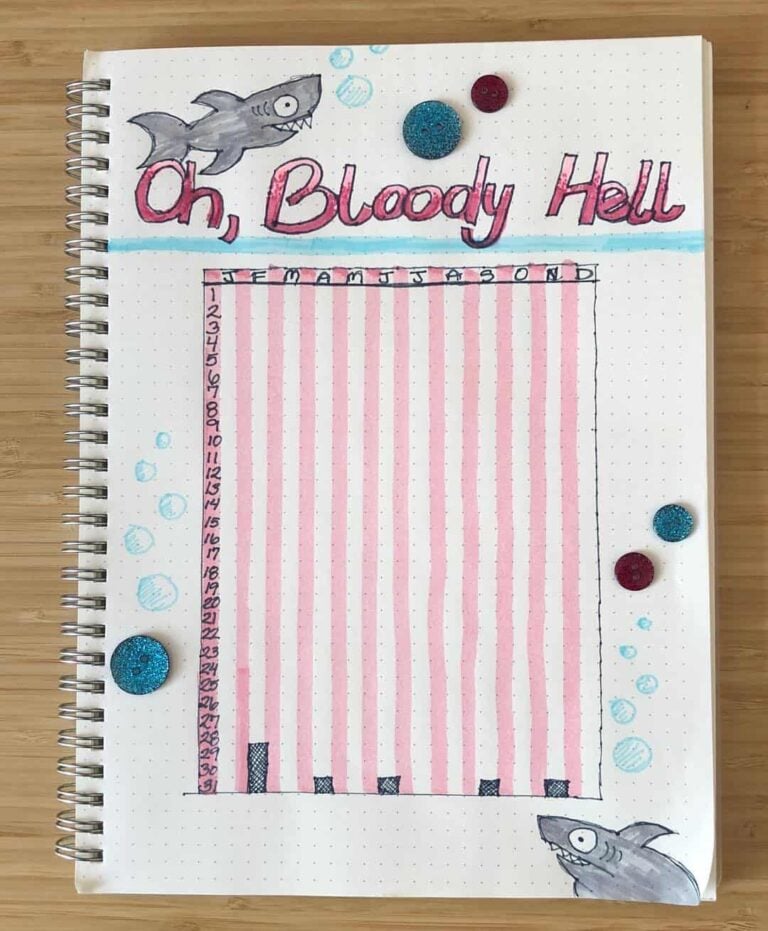
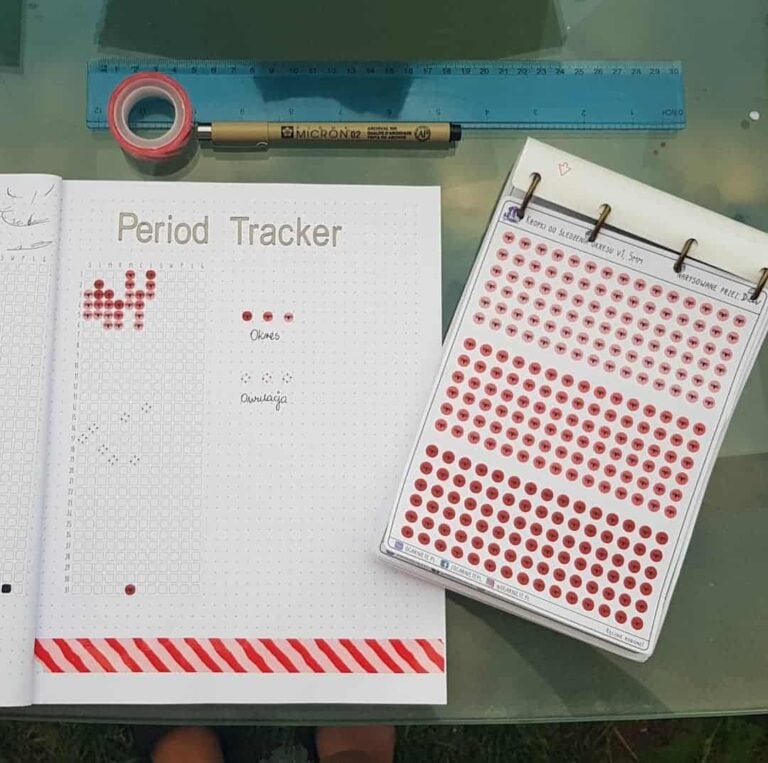


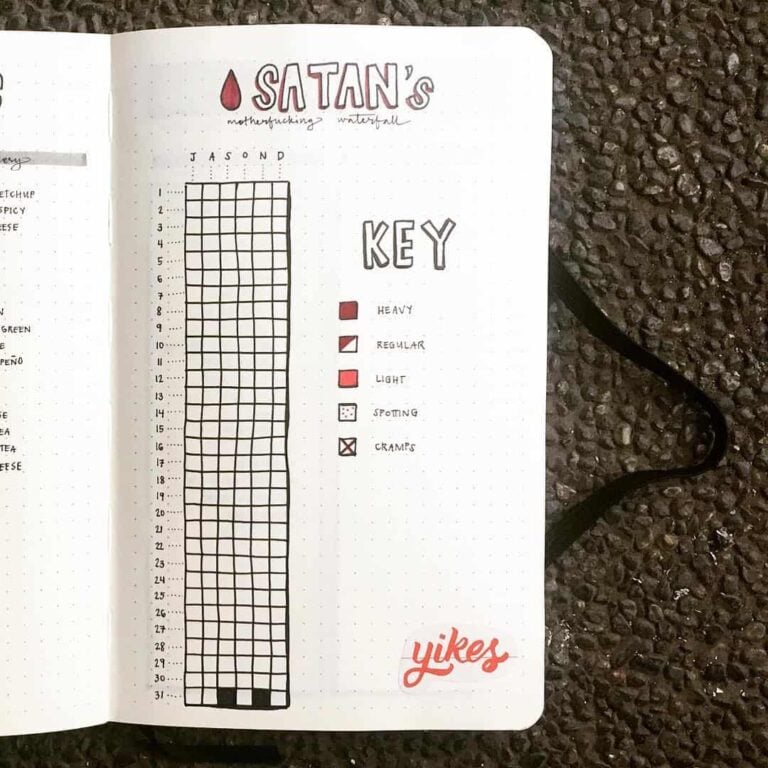
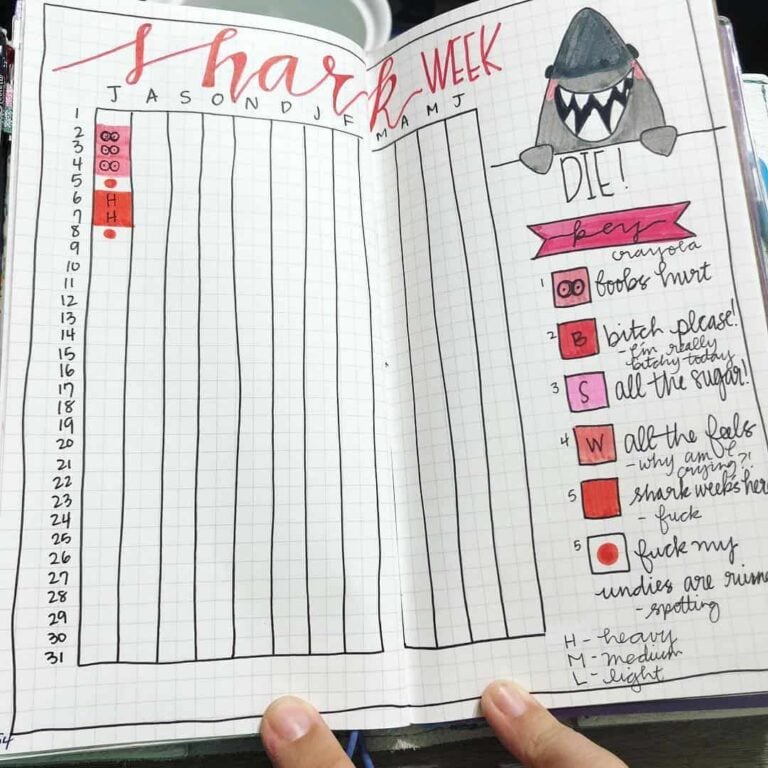
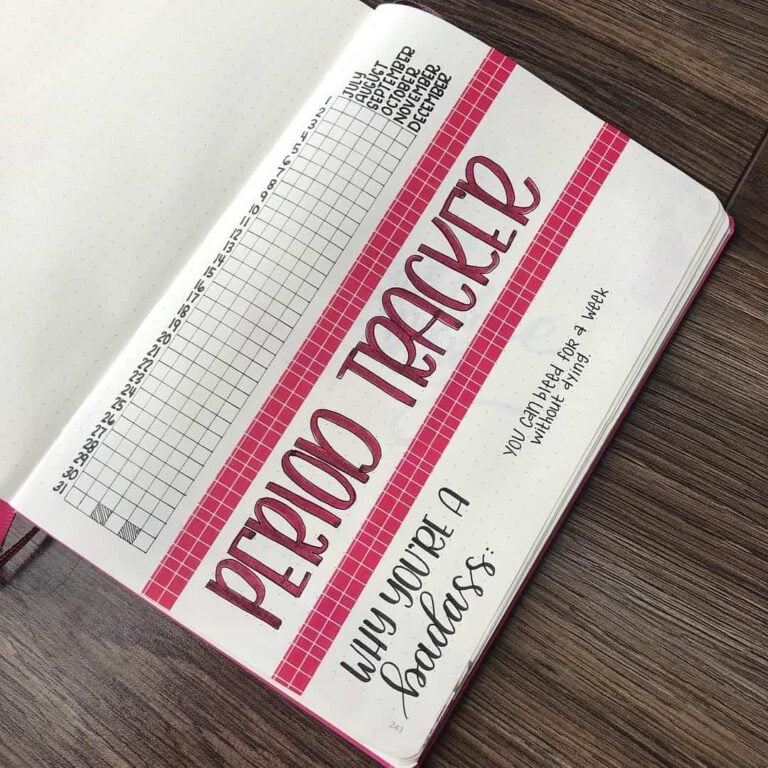


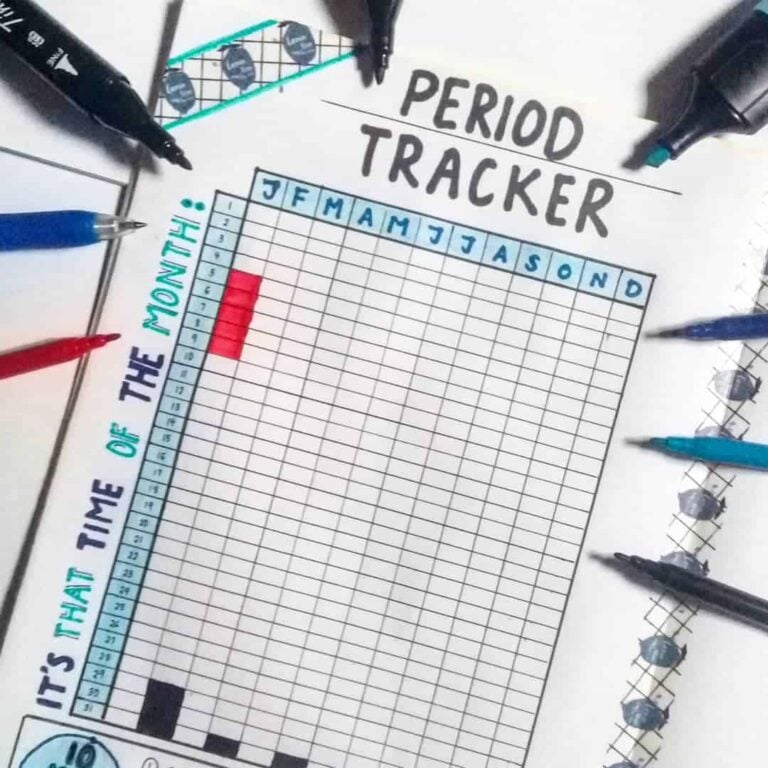
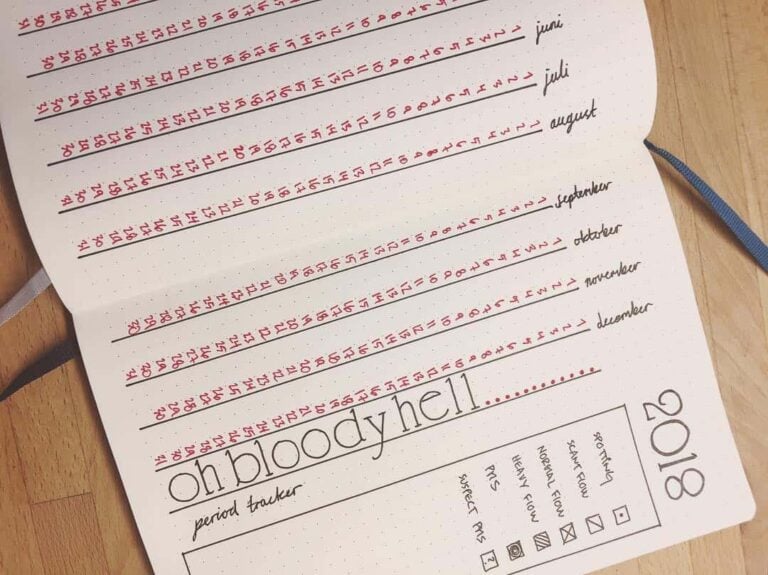
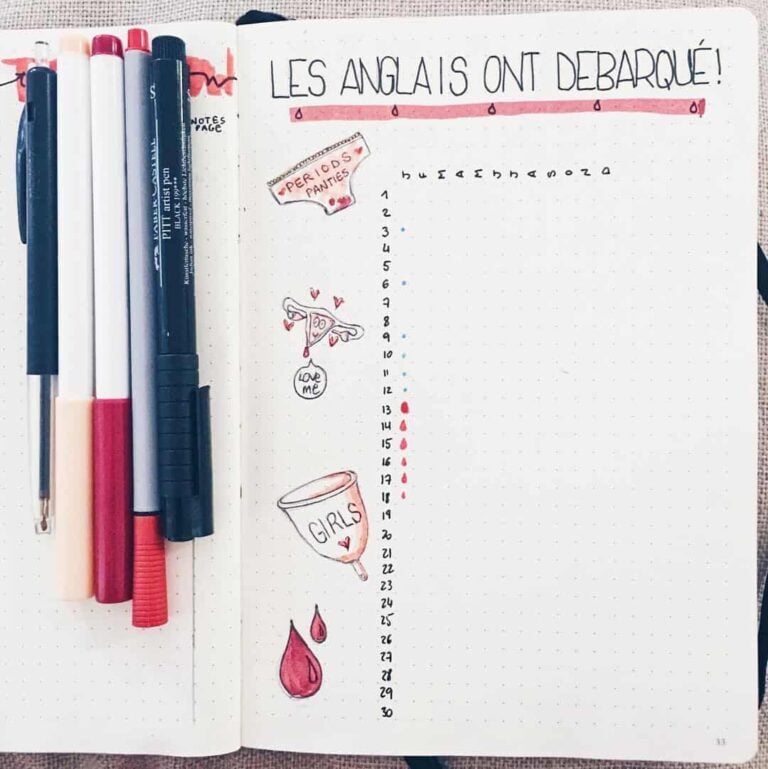
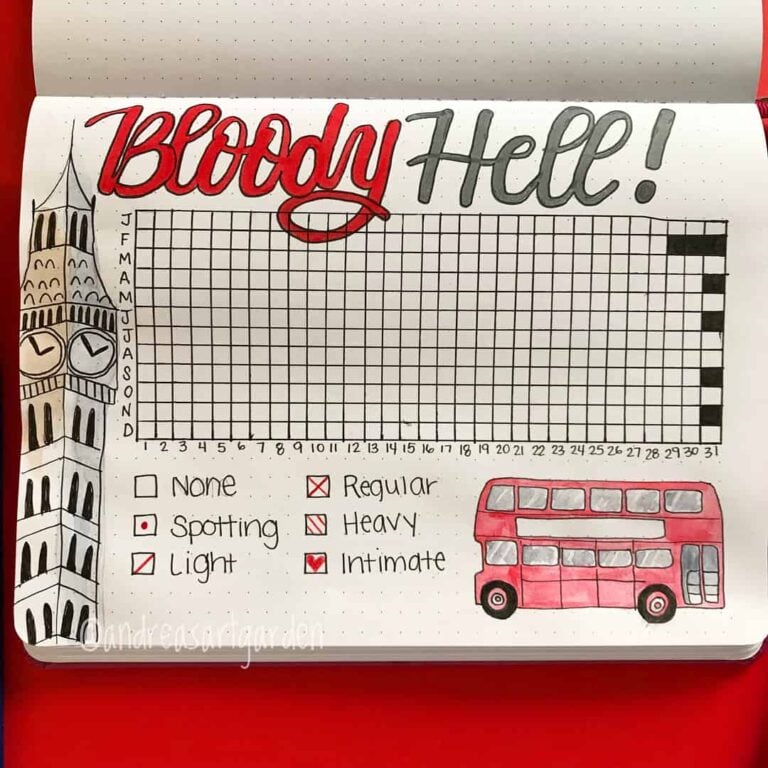

What the trackers above do, more than anything else, is shift the cycle from something that is mostly lived through to something that is also recorded. The recording is not the point. The shift in attention is. A month of bleeding days marked on a page is also a month of small observations — about energy, about sleep, about which days asked more of the body than usual — that would otherwise have passed by without being noted. The page holds them. What is done with them after that is up to the person who drew the page.